Newsletter
One email. Every week. Pure signal.
The week in quality engineering — skip an issue, and you'll wish you hadn't.
20K+ engineers already reading
Quality Metrics That Matter: What Engineering Teams Should Track

Oct 7, 2026
The quality metrics that matter measure outcomes users feel rather than team activity. The most useful are defect escape rate (production defects as a share of all defects), change failure rate, mean time to restore, lead time for changes, test suite reliability and suite duration. Vanity metrics such as test count, bugs per tester or code coverage used as a target are easy to game and rarely change decisions.

Most quality dashboards are full of numbers that go up and to the right while users keep finding bugs. Test count climbs, coverage hits 85 percent, pass rate sits at 99 percent, and the incident channel is as busy as ever. The metrics are not wrong. They are just measuring activity instead of outcomes.
This guide covers the quality metrics that actually tell an engineering team whether its software is getting better: what each one measures, how to calculate it, and the mistakes that turn a useful metric into a target people game.
What makes a quality metric useful?
- It reflects what users experience, not just what the team did.
- It changes a decision. If nobody would act differently when it moves, drop it.
- It is hard to game without actually improving quality.
- It is cheap to collect automatically from tools you already have.
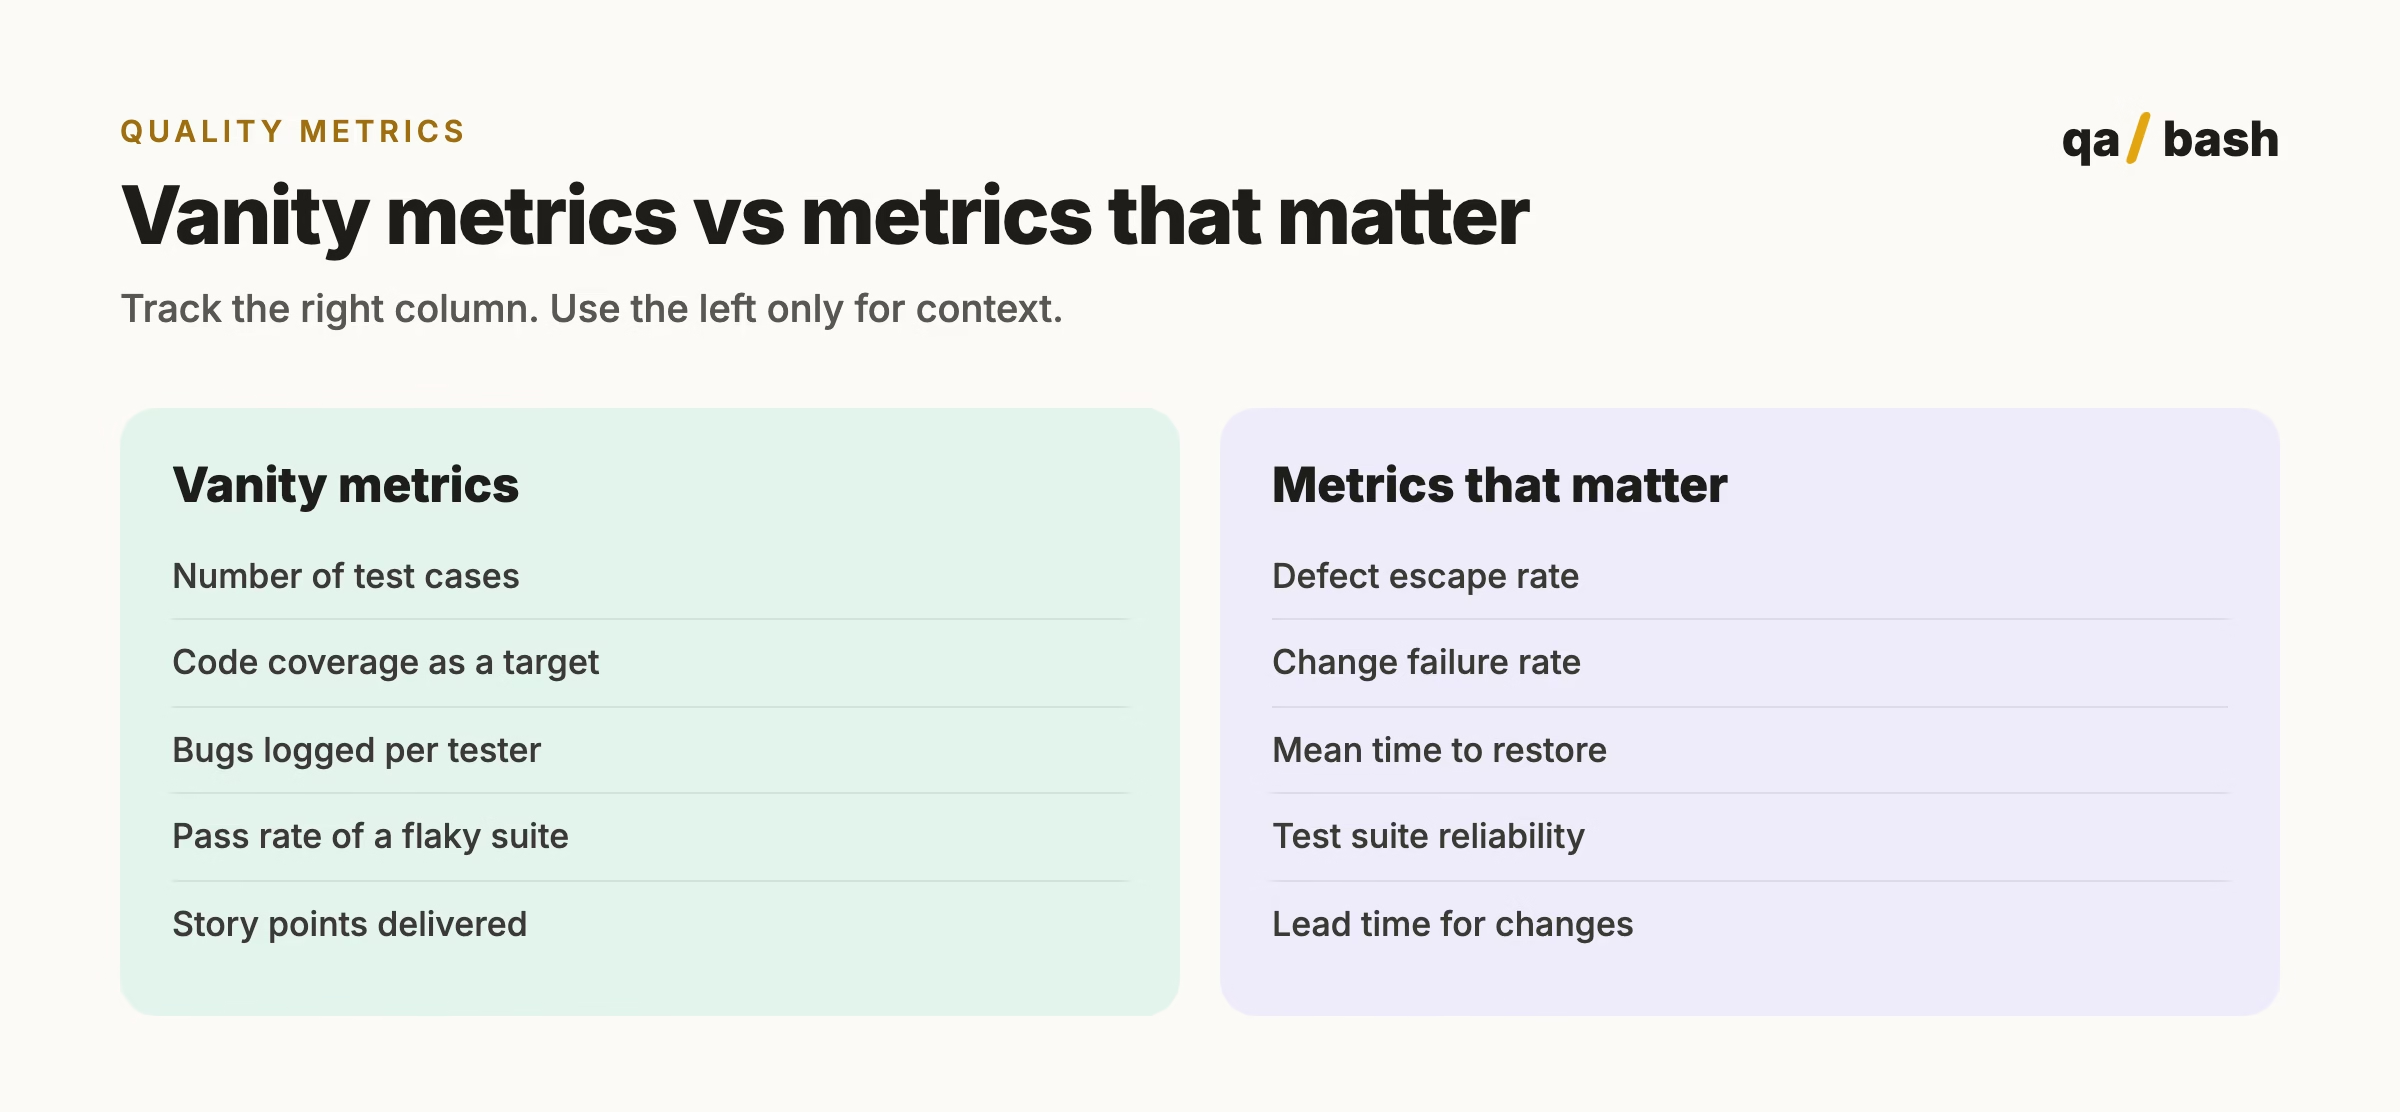
The quality metrics that matter
| Metric | How to calculate it | Good sign | Watch out for |
|---|---|---|---|
| Defect escape rate | Production defects ÷ all defects found in a period | Falling over time | Under-reporting of production issues |
| Change failure rate | Deployments causing an incident or rollback ÷ all deployments | Low and stable | Teams avoiding deploys to protect it |
| Mean time to restore (MTTR) | Average time from incident start to recovery | Hours, not days | Closing incidents before users recover |
| Lead time for changes | Commit to running in production | Short and predictable | Skipping tests to shorten it |
| Test suite reliability | Runs with no flaky failures ÷ all runs | Above 95 percent | Retries hiding flakiness |
| Suite duration | Time for the pipeline’s test stages | Fits fast feedback, usually minutes | Deleting useful tests to save time |
| Defect severity mix | Share of escaped defects that are critical or high | Shifting toward low severity | Severity labels drifting |
| Requirement coverage | Critical acceptance criteria with at least one automated test | Near complete for critical flows | Counting trivial tests as coverage |
Change failure rate, lead time and time to restore are three of the DORA metrics, which link software delivery performance to business outcomes and are widely used for benchmarking.
Defect escape rate in detail
If you track only one metric, track this one. It answers the question every quality effort exists for: how many problems reached users?
Defect escape rate = defects found in production / (defects found before release + defects found in production)

Example: 6 production defects, 54 found during testing
6 / (54 + 6) = 10% escape rate
Break it down by severity and by component. A 10 percent escape rate made of cosmetic issues is healthy; one made of payment failures is not.
Why code coverage should not be a target
Coverage tells you which code ran during tests, not whether anything was checked. A test with no assertions can push coverage up. Use coverage to find untested areas, especially in critical modules, and never as a goal on its own. A drop in coverage on a critical file is worth a conversation; a team-wide 80 percent target usually produces tests nobody needed.
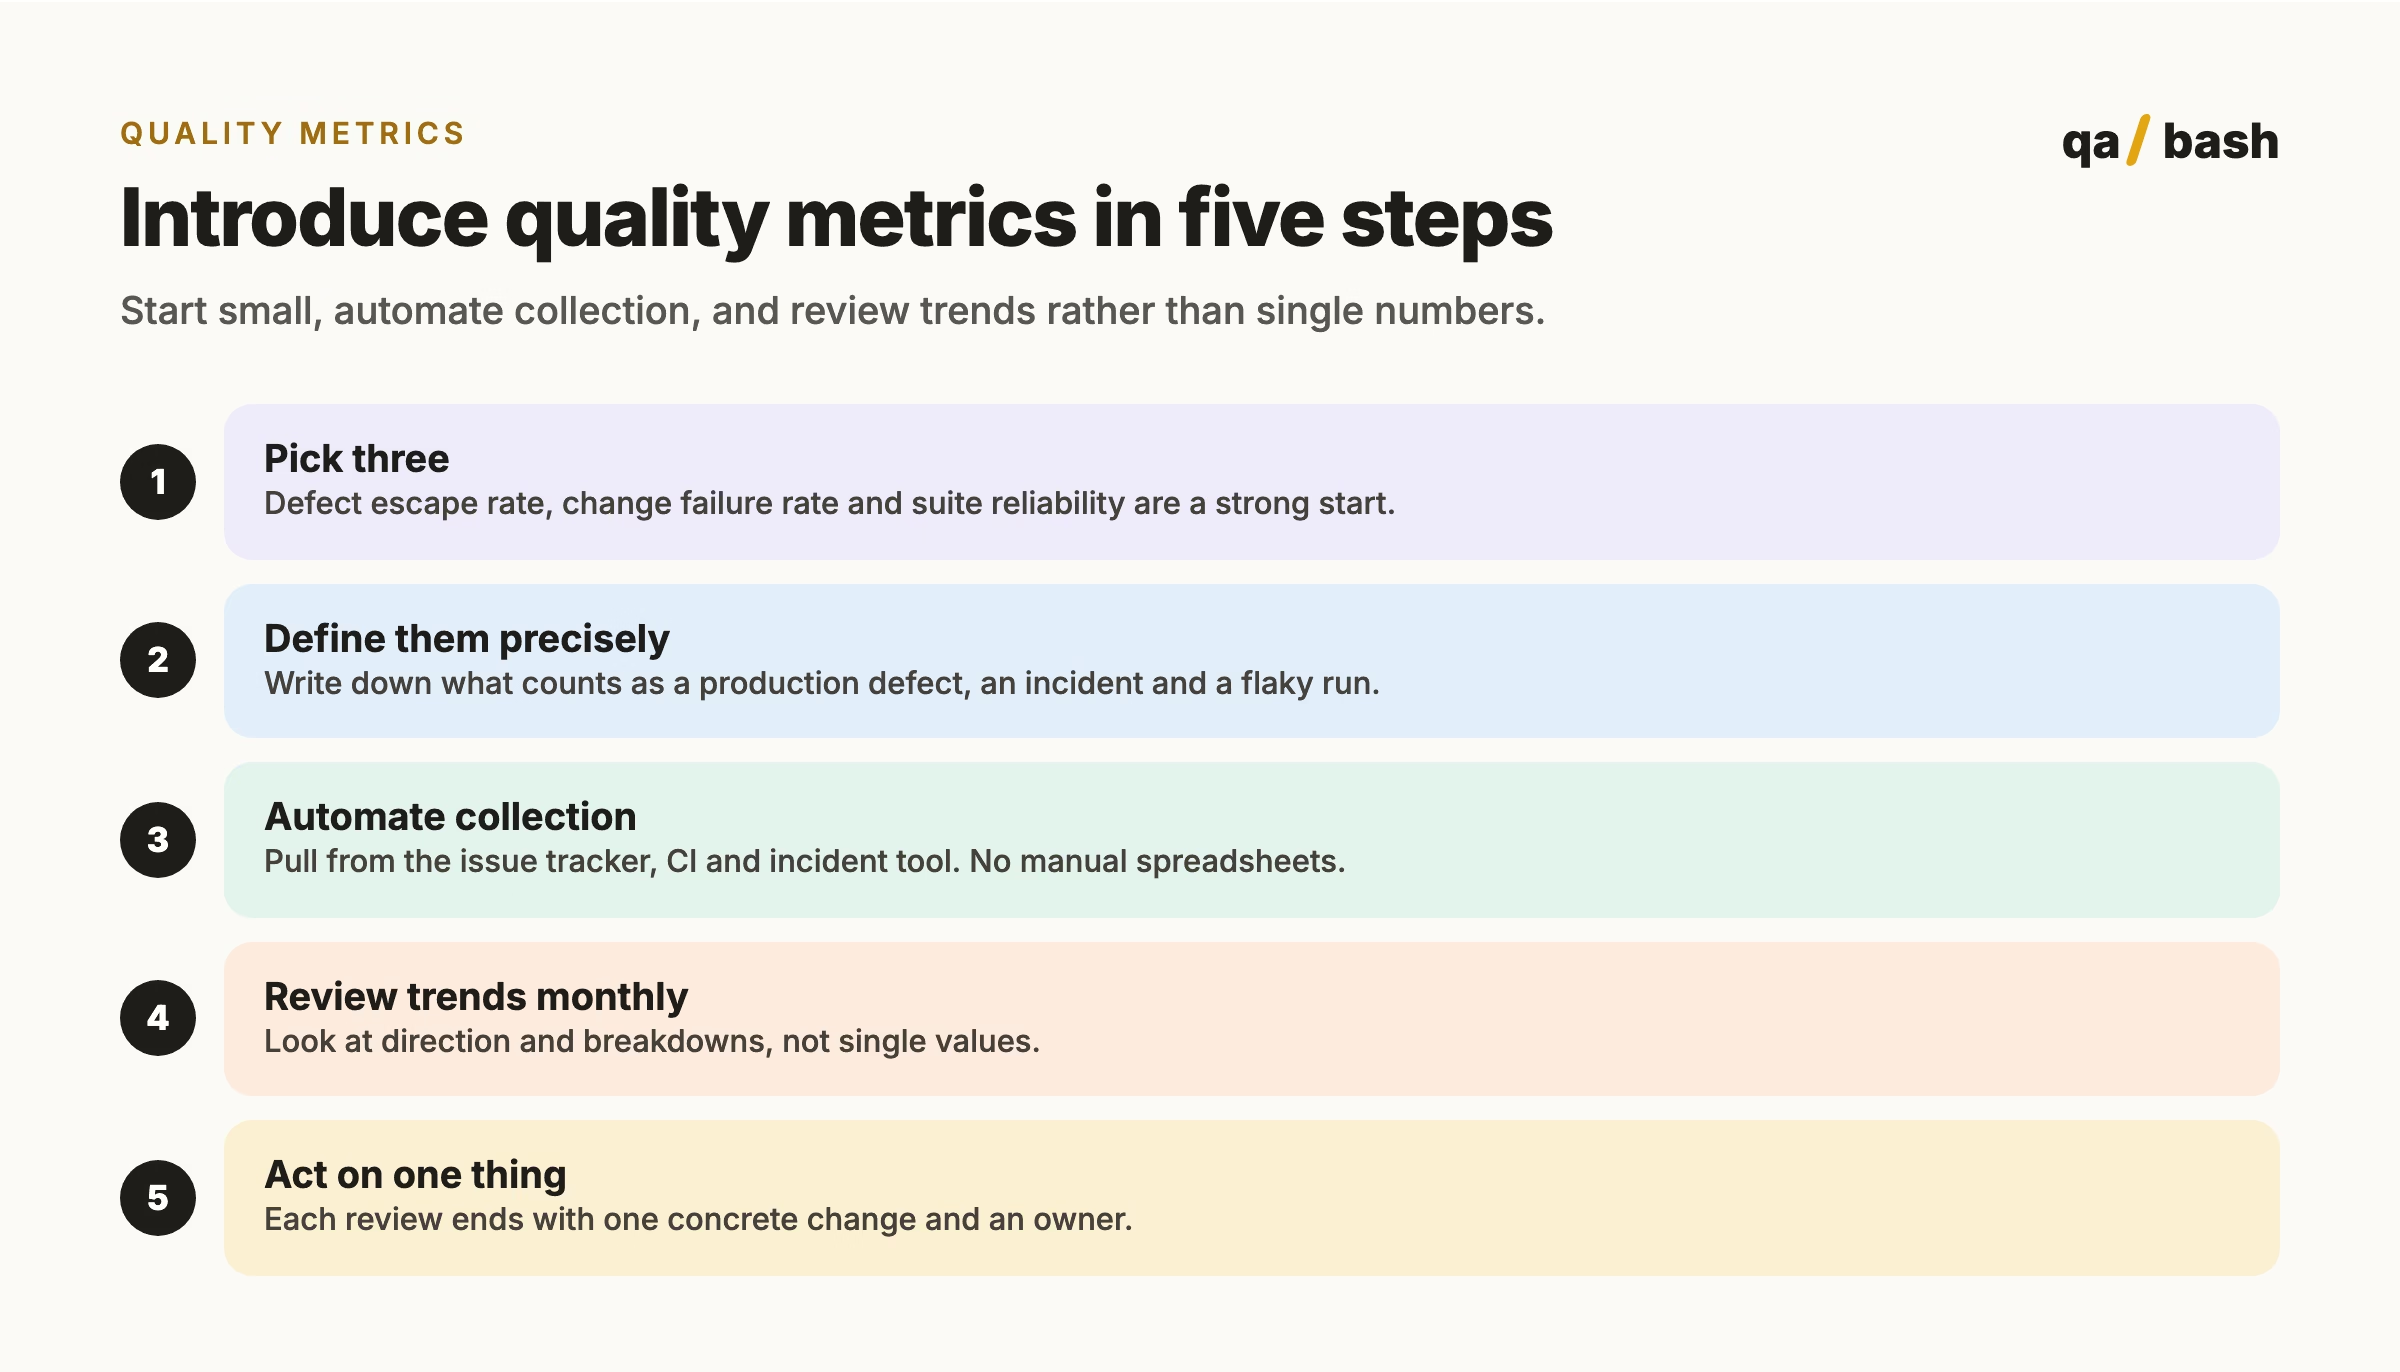
How to roll out quality metrics
Common mistakes with quality metrics
- Turning metrics into individual targets. Ranking testers by bugs found rewards noise and hurts collaboration.
- Too many metrics. A dashboard of twenty numbers gets ignored. Three to five is enough.
- No definitions. If two teams count defects differently, comparisons are meaningless.
- Looking at single values. One bad month is noise; three months of rising escapes is a signal.
- Measuring QA alone. Quality is a team outcome. Share the metrics with developers and product.
Metrics are one part of scaling quality across teams. Our guide to building quality at scale covers culture, automation and quality gates, and the SDET roadmap shows where metrics ownership fits in a QA career.
Rate this article
9.0/10 average · 25 ratings
Discussion
Start the conversation
What do you think about this article? Share your experience, ask a question, or add to the discussion.

He’s a builder of communities, a collector of questions, and a relentless challenger of assumptions. While others chase answers, he chases better questions. While others talk about the future of testing, he quietly helps create it.
Frequently asked questions.
What are the most important software quality metrics?
Defect escape rate, change failure rate, mean time to restore, lead time for changes, test suite reliability and suite duration give the clearest picture of quality as users experience it.
How do you calculate defect escape rate?
Divide defects found in production by the total of defects found before release plus defects found in production. For example, 6 production defects and 54 pre-release defects give a 10 percent escape rate.
Related articles

Writing Test Cases for Automation: How to Make Every Case Automation-Ready
This guide explains how to write test cases for automation that are atomic, independent and deterministic,…
4 min
Production Bug Response: A QA Engineer’s Incident Playbook
Bugs slipping into production are inevitable—but they don’t have to be setbacks. When addressed with the…
1 min