Trace-Based Testing for AI Agents: Test the Trace, Not the Reply

qabash.comAmbassador
Nov 23, 2026
Quick answer
Trace-based testing for AI agents means instrumenting the agent with OpenTelemetry spans (one per agent run, model call and tool call) and writing assertions against the recorded trace instead of the final reply. In tests, capture spans with an in-memory exporter and assert on tool order, number of model calls, token usage and step limits. In production, run the same checks over real traces to catch loops, cost spikes and skipped steps.
An agent answers “Your refund of $40 has been processed.” The reply is polite, correct and tells you almost nothing.
Did it look up the order first? Did it call the refund tool once or three times? Did it burn 50,000 tokens in a loop before getting there? The reply hides all of it. The trace shows all of it.
This guide covers trace-based testing for AI agents: instrument the agent once with OpenTelemetry, then use the same spans as test oracles in CI and as monitors in production. The code runs in under a second with no model and no backend.
Why test the trace instead of the reply?
Replies are the worst place to test an agent:
- They vary. The same correct outcome can be phrased a hundred ways.
- They can lie. A model can say “refund processed” when no refund tool ran.
- They hide cost. A correct reply after twelve model calls is a production incident waiting for traffic.
A trace records what actually happened: every model call, every tool call, in order, with timing, token counts and errors. Those are facts, not prose, so they make stable oracles.
There’s a second benefit. Most teams add tracing for production observability anyway. Testing against traces means one instrumentation serves both QA and operations, and the checks you write in CI can run against live traffic.
What does an AI agent trace look like?
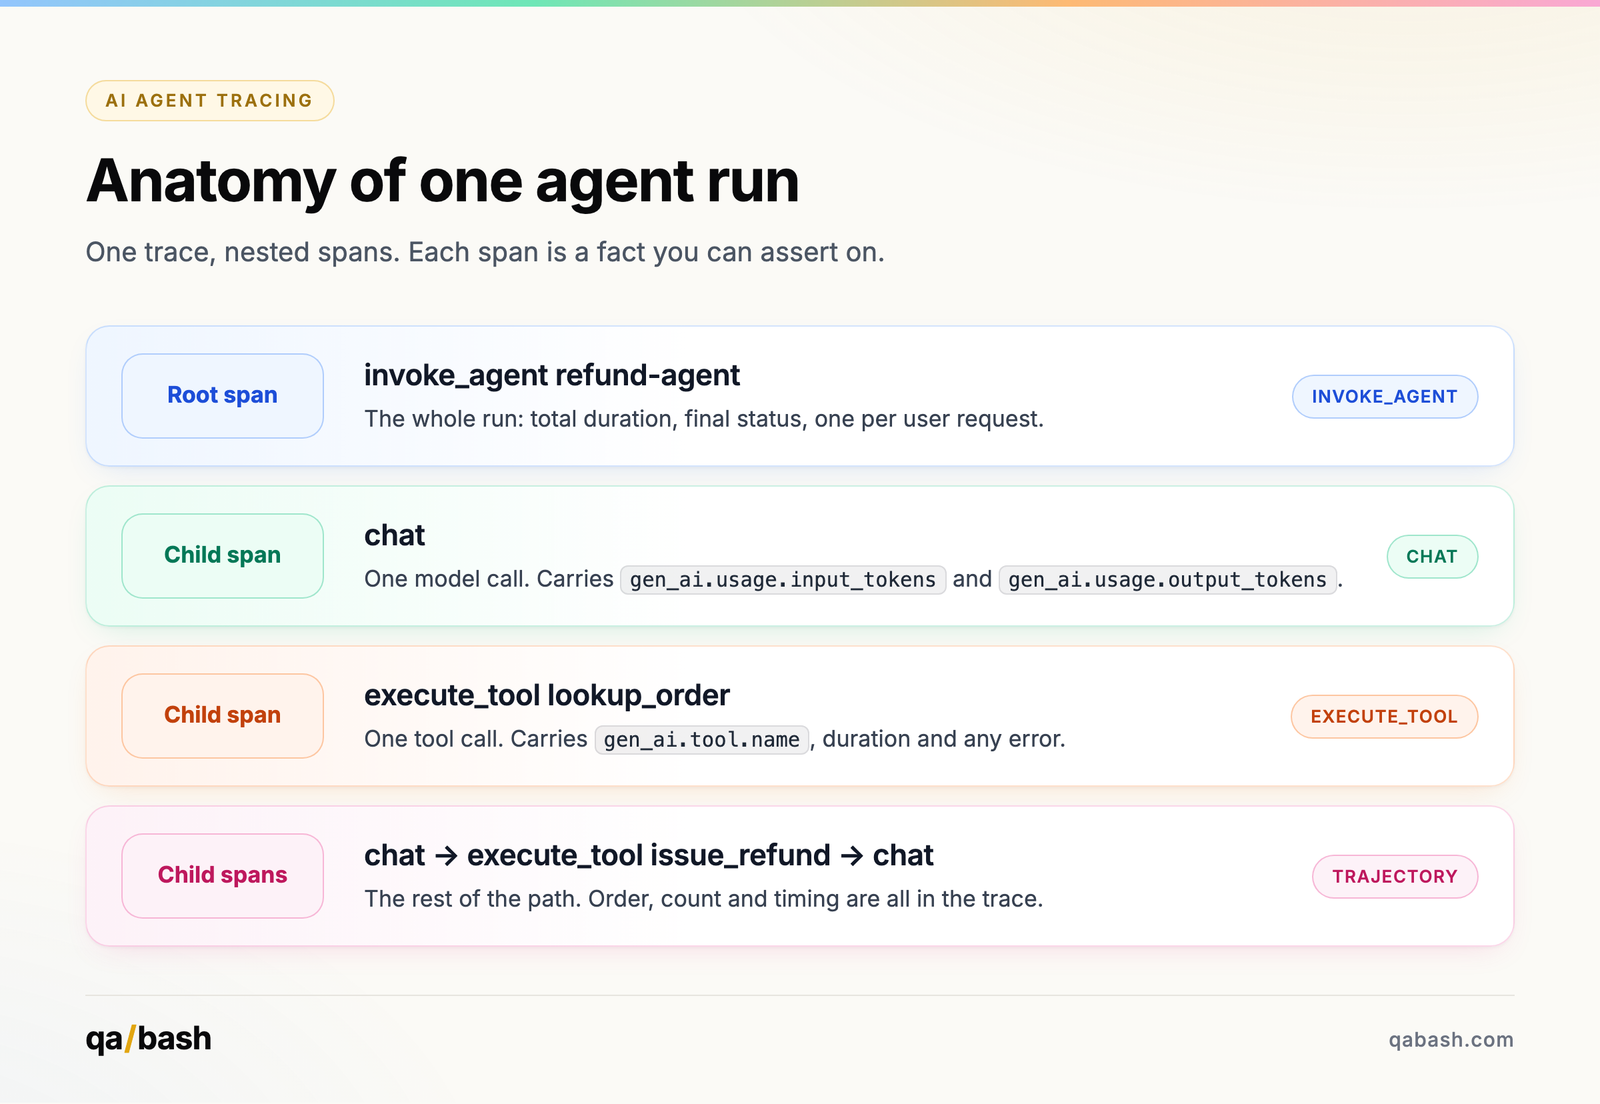
OpenTelemetry GenAI semantic conventions in one minute
OpenTelemetry defines semantic conventions for generative AI: standard span names and attributes so traces look the same across frameworks and vendors. The ones this guide uses:
| Attribute or name | Meaning |
|---|---|
gen_ai.operation.name |
What the span does: invoke_agent, chat, execute_tool and others |
invoke_agent {gen_ai.agent.name} |
Span name for one agent run |
execute_tool {gen_ai.tool.name} |
Span name for one tool call |
gen_ai.tool.name |
Which tool ran |
gen_ai.usage.input_tokens / gen_ai.usage.output_tokens |
Token counts for a model call |
gen_ai.provider.name |
Which model provider served the call |
One caution: as of November 2026, the GenAI conventions are still marked Development, and they now live in their own repository (semantic-conventions-genai). Names can still change. Keep them in one constants block, as below, so a rename is a one-line fix rather than a hunt through your test suite.
Many agent frameworks and LLM SDKs can emit these spans through instrumentation libraries. The example instruments by hand so you can see every attribute.
Instrumenting an agent for testing
A small refund agent: it loops, asks the model what to do next, runs tools and stops at a step budget. Every model call and tool call gets a span.
# agent.py: a refund agent instrumented with OpenTelemetry GenAI-style spans
from opentelemetry import trace

tracer = trace.get_tracer("refund-agent")

# GenAI semantic conventions are still "Development" status: keep names in one place
OP, TOOL, IN_TOK, OUT_TOK = (
    "gen_ai.operation.name", "gen_ai.tool.name",
    "gen_ai.usage.input_tokens", "gen_ai.usage.output_tokens",
)
TOOLS = {
    "lookup_order": lambda order_id: {"order_id": order_id, "paid": 40.0},
    "issue_refund": lambda order_id, amount: {"refunded": amount},
}


def run_agent(model, request: str, max_steps: int = 5) -> str:
    with tracer.start_as_current_span("invoke_agent refund-agent") as root:
        root.set_attribute(OP, "invoke_agent")
        history = [request]
        for _ in range(max_steps):
            with tracer.start_as_current_span("chat") as span:
                span.set_attribute(OP, "chat")
                step = model(history)  # {"tool":..., "args":...} or {"answer":...}
                span.set_attribute(IN_TOK, step["usage"][0])
                span.set_attribute(OUT_TOK, step["usage"][1])
            if "answer" in step:
                return step["answer"]
            with tracer.start_as_current_span(f"execute_tool {step['tool']}") as span:
                span.set_attribute(OP, "execute_tool")
                span.set_attribute(TOOL, step["tool"])
                history.append(TOOLS[step["tool"]](**step["args"]))
        return "Stopped: step budget reached"
The model is injected. In tests, a scripted fake replays fixed steps so the trace is deterministic. In production, the real model runs and the same spans are exported to your observability backend.
Writing trace assertions in pytest
The OpenTelemetry Python SDK ships an InMemorySpanExporter. Spans go into a list instead of a backend, and tests read them back.
# test_agent_traces.py: assert on what the agent did, read from its trace
import pytest
from opentelemetry import trace
from opentelemetry.sdk.trace import TracerProvider
from opentelemetry.sdk.trace.export import SimpleSpanProcessor
from opentelemetry.sdk.trace.export.in_memory_span_exporter import InMemorySpanExporter

from agent import IN_TOK, OP, OUT_TOK, TOOL, run_agent

exporter = InMemorySpanExporter()
provider = TracerProvider()
provider.add_span_processor(SimpleSpanProcessor(exporter))
trace.set_tracer_provider(provider)


def scripted_model(steps):
    """A fake model that replays fixed steps, so the trace is deterministic."""
    it = iter(steps)
    return lambda history: next(it)


HAPPY = [
    {"tool": "lookup_order", "args": {"order_id": "A1"}, "usage": (900, 40)},
    {"tool": "issue_refund", "args": {"order_id": "A1", "amount": 40.0}, "usage": (1100, 30)},
    {"answer": "Refunded 40.00", "usage": (1200, 20)},
]


@pytest.fixture(autouse=True)
def clear_spans():
    exporter.clear()


def spans_by_op(op):
    return [s for s in exporter.get_finished_spans() if s.attributes.get(OP) == op]


def test_lookup_happens_before_refund():
    run_agent(scripted_model(HAPPY), "Refund order A1")
    tools = [s.attributes[TOOL] for s in sorted(spans_by_op("execute_tool"), key=lambda s: s.start_time)]
    assert tools == ["lookup_order", "issue_refund"]


def test_token_budget_per_request():
    run_agent(scripted_model(HAPPY), "Refund order A1")
    chats = spans_by_op("chat")
    total = sum(s.attributes[IN_TOK] + s.attributes[OUT_TOK] for s in chats)
    assert len(chats) <= 4 and total <= 5000


def test_every_span_belongs_to_one_agent_run():
    run_agent(scripted_model(HAPPY), "Refund order A1")
    spans = exporter.get_finished_spans()
    assert len({s.context.trace_id for s in spans}) == 1
    assert len(spans_by_op("invoke_agent")) == 1


def test_looping_agent_hits_the_step_budget():
    loop = [{"tool": "lookup_order", "args": {"order_id": "A1"}, "usage": (900, 40)}] * 10
    assert run_agent(scripted_model(loop), "Refund order A1", max_steps=3).startswith("Stopped")
    assert len(spans_by_op("execute_tool")) == 3
pip install opentelemetry-sdk pytest
pytest -q
# 4 passed in 0.10s
What each test protects:
- Tool order. A refund before a lookup means the agent acted on an amount it never checked. The reply would look identical.
- Token budget. Cost regressions show up here first, often after a prompt change that “only added a few instructions.”
- One trace per run. Broken context propagation splits a run across traces and blinds production monitoring. This test catches it before it ships.
- Step budget. A looping agent must stop, and the trace proves exactly how many tool calls it made.
Sort spans by start_time when order matters. The exporter records spans as they finish, and a parent span finishes after its children.
From CI to production: the same checks twice
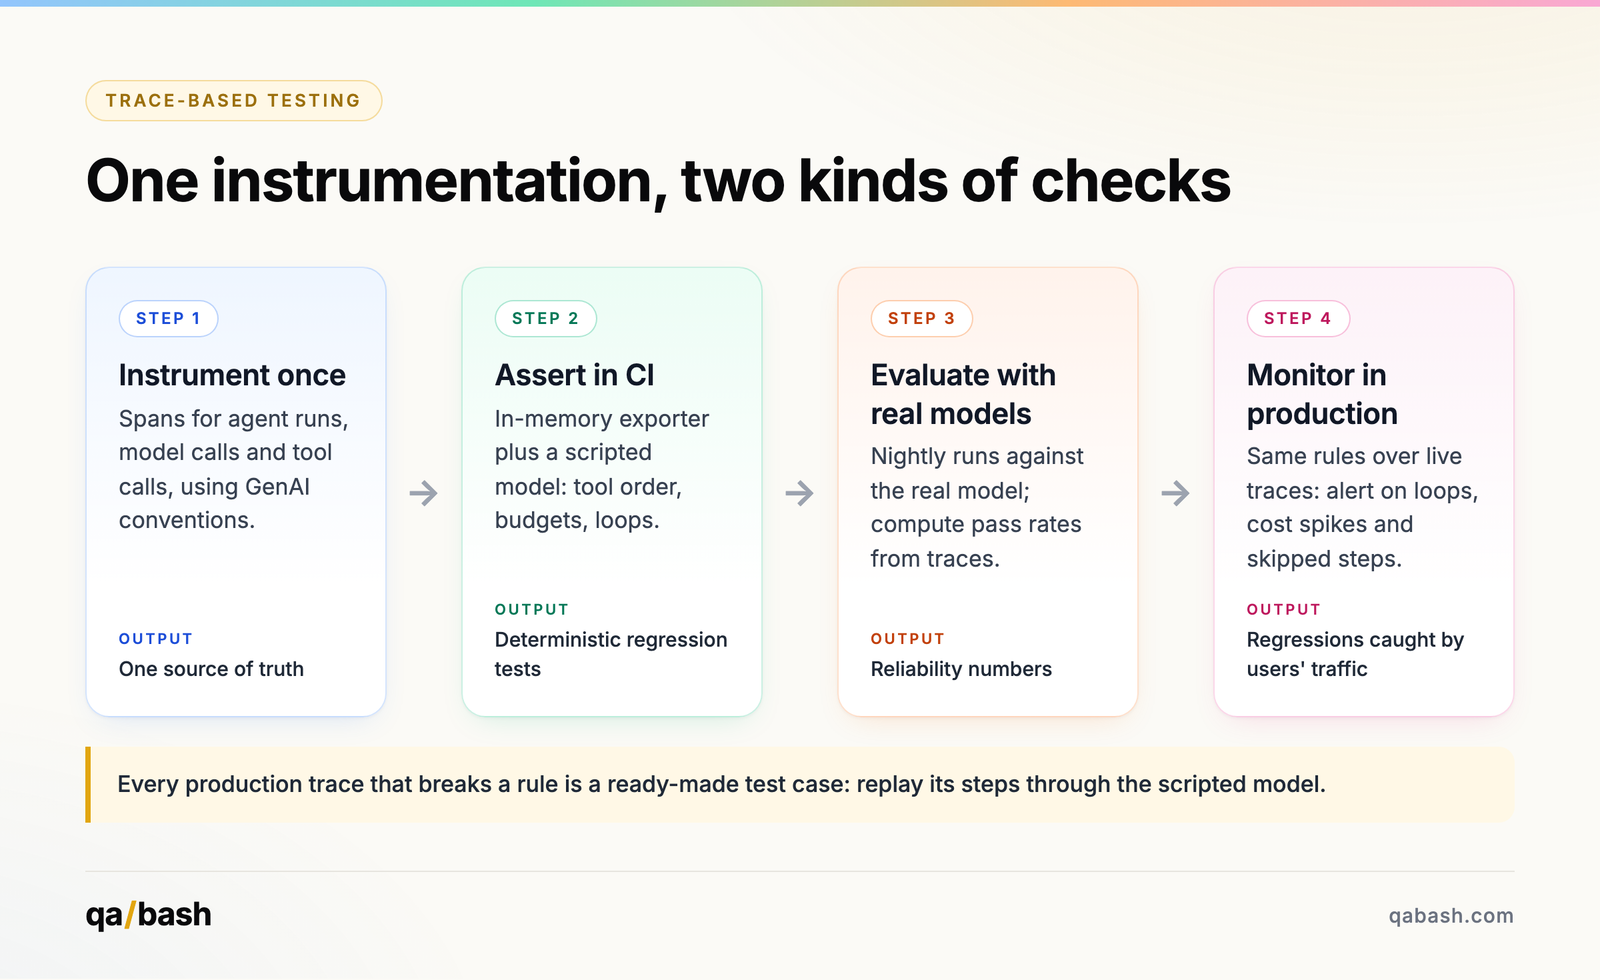
The production step is where trace-based testing pays off. The rule “issue_refund never runs before lookup_order” is a test in CI and an alert in production. When it fires in production, the trace contains every step, so turning the incident into a regression test is mechanical.
Real-model runs vary, so treat trace rules there as rates. “The agent used more than 8 model calls in 3% of runs this week” is a measurement, and Testing Non-Deterministic AI shows how to judge whether it changed.
What to assert on in an agent trace
| Check | Trace evidence | Why it matters |
|---|---|---|
| Required step happened | An execute_tool span with the expected tool name |
The agent can’t claim work it didn’t do |
| Order of steps | Span start times | Verify before act; read before write |
| No forbidden tools | Tool names against an allowlist | Catches excessive agency and injection effects |
| Step count | Number of chat and execute_tool spans |
Detects loops and dithering |
| Token and cost budget | Sum of usage attributes | Cost regressions after prompt changes |
| Latency budget | Root span duration | User-facing slowness |
| Errors handled | Error status on tool spans, followed by a sensible next step | Recovery behaviour, not just happy paths |
| Single run per request | One trace ID, one invoke_agent span |
Broken propagation blinds monitoring |
Common mistakes testers make
| Mistake | Why it happens | Better approach |
|---|---|---|
| Asserting on reply text | It’s the visible output | Assert on spans; check the reply loosely |
| Hard-coding attribute strings everywhere | Copying from docs | One constants block; conventions are still evolving |
| Ordering spans by export order | The list looks ordered | Sort by start_time |
| Tracing only in production | “Observability is ops’ job” | Use the same instrumentation as a test oracle |
| Logging prompts and outputs with personal data | Debugging convenience | Redact or opt-in; content capture is a privacy decision |
| Ignoring the trace when tests pass | Green is green | Check budgets even on passing runs |
Interview questions
Beginner
What is a trace?
A record of one request’s path through a system, made of nested spans.
What is a span?
One timed operation, such as a model call or tool call, with attributes.
Why test traces instead of agent replies?
Traces record what the agent did; replies only describe it.
What is OpenTelemetry?
An open standard and set of SDKs for traces, metrics and logs.
Intermediate
What are GenAI semantic conventions?
Standard span names and attributes for AI operations, such as gen_ai.operation.name and gen_ai.usage.input_tokens.
How do you capture spans in a unit test?
Use the SDK’s InMemorySpanExporter with a SimpleSpanProcessor.
Why sort spans by start time?
Spans are exported when they end, so parents appear after children.
What does a token budget test catch?
Cost regressions from prompt changes, loops and extra model calls.
Advanced
How do you reuse CI trace checks in production?
Express them as rules over span data and evaluate them in your observability backend as alerts.
How do you handle unstable conventions?
Centralize names, pin instrumentation versions and add a test that fails loudly if expected attributes disappear.
How would you turn a production incident into a test?
Extract the model’s steps from the trace and replay them through a scripted model in CI.
What are the privacy risks of LLM tracing?
Prompts and outputs can contain personal data; capture content only deliberately, with redaction and retention limits.
How AI changes this
Agents made observability a testing concern. A web request has a predictable path; an agent decides its path at run time. That makes the trace the only reliable record of behaviour, and the natural place for assertions.
AI also helps you use traces. Models are good at summarizing long traces, clustering similar failures and suggesting which rule a bad run broke. Keep the rules themselves explicit and in code.
Into 2027, expect the GenAI conventions to stabilize, more frameworks to emit them by default, and observability platforms to offer trace-based evaluations out of the box. Teams who already treat traces as test data will get the most from that. Tools change. Testing principles endure.
Best practices checklist
- Instrument agent runs, model calls and tool calls as spans
- Follow the GenAI conventions, with names in one constants block
- Capture spans in tests with the in-memory exporter
- Assert on tool order, tool allowlists and step counts
- Set token and latency budgets and test them
- Sort spans by start time before checking order
- Run the same rules on production traces as alerts
- Decide deliberately whether to capture prompt and output content
Conclusion
Trace-based testing for AI agents moves your oracle from what the agent said to what it did. Tool order, budgets and loops become plain assertions, and the instrumentation you add for testing keeps paying off in production.
Start small: wrap model and tool calls in spans, add the in-memory exporter, and write one test that checks the agent verifies before it acts.
The best testers don’t just find bugs. They uncover risks.
Keep testing. Keep learning. Keep questioning.
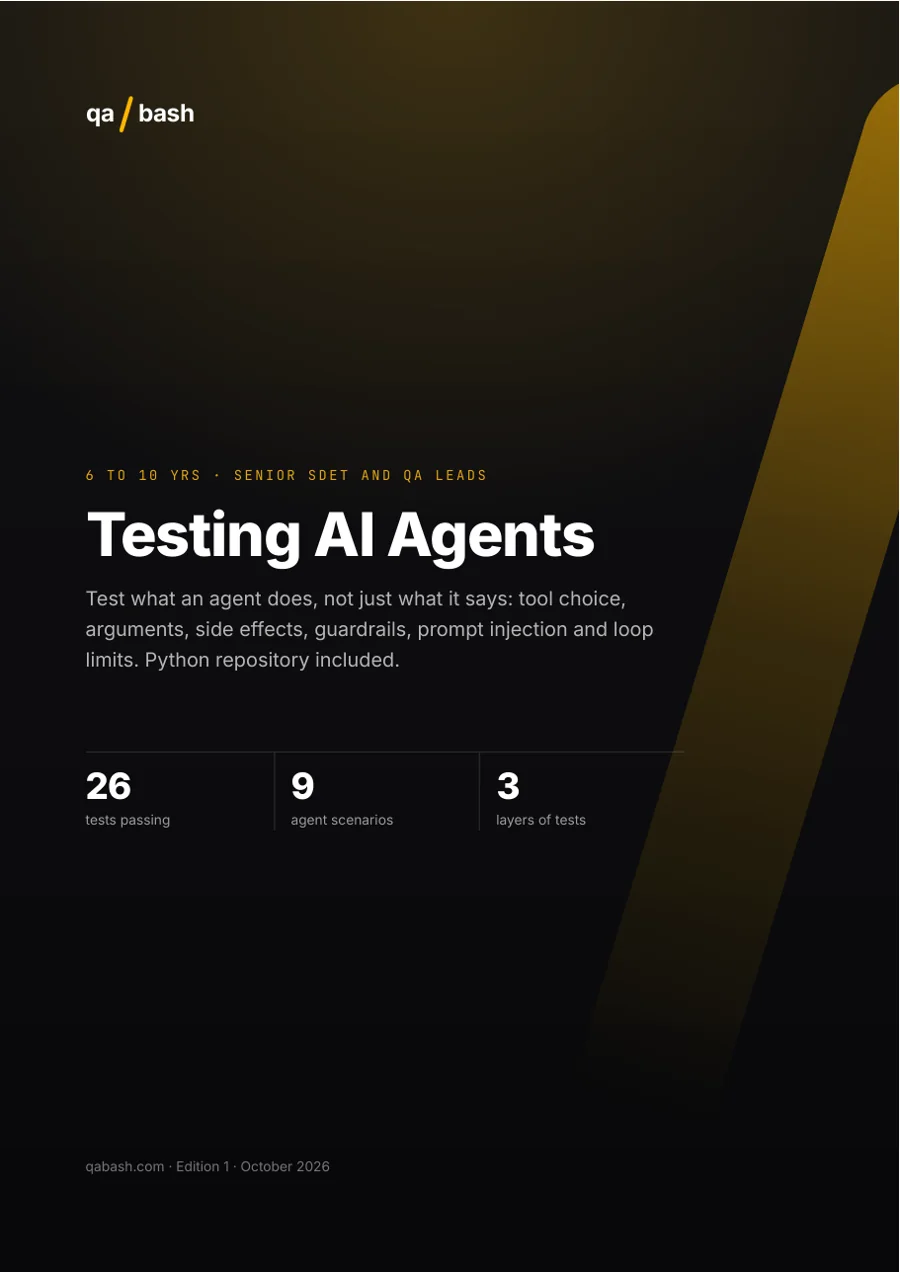
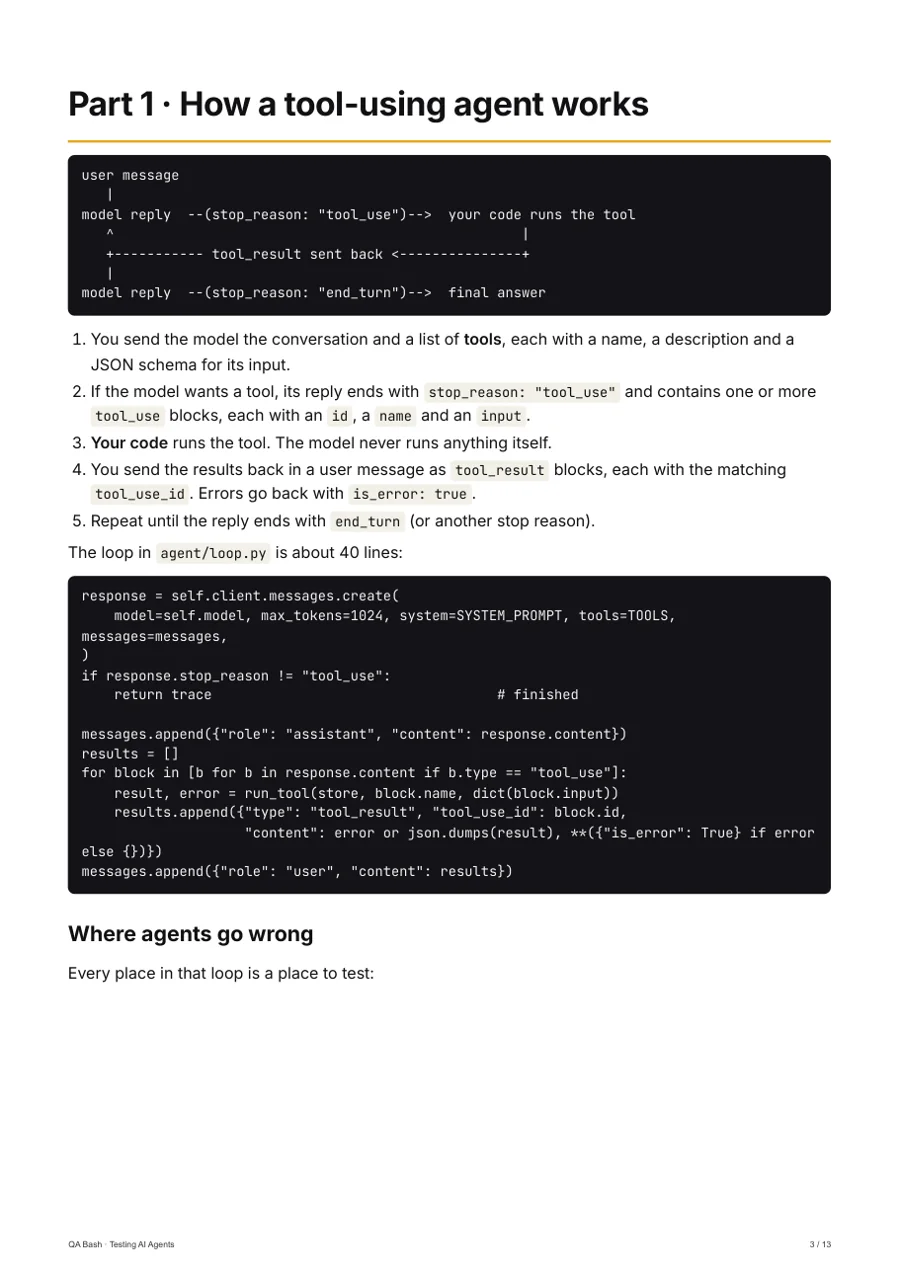
Go deeper · QA Bash kit
Testing AI Agents
Test what an AI agent does: tool calls, side effects, guardrails, prompt injection and loop limits.
6–10 yrs · 26 passing tests
₹799₹999
Rate this article
8.9/10 average · 18 ratings
Discussion
Be the first to weigh in
Your question or experience helps the next tester who reads this. Sign in and earn +25 XP for every approved comment or reply.
Written by

Frequently asked questions.
Keep reading